
1. Introduction
Snowflake has a unique way of making data retrieval faster and more efficient using Caching technique. Traditional caching techniques struggle to keep up and give quick access to commonly used data as data kept increasing bigger and more complex. But with Snowflake Caching, it splits up the cached data into different layers, like a hierarchy, which makes it easier to find and retrieve when needed. This unique form of caching can accelerate application performance significantly and relieve part of the load on the main system.
In this article, let us discuss how Snowflake Caching works, different types of Cache available, and how they are used.
2. Types of Cache in Snowflake
There are three types of Cache in Snowflake which improve the query performance.
- Query Result Cache
- Metadata Cache
- Virtual Warehouse Cache (or) Local Disk Cache
All these cache are enabled by default in your Snowflake environment.
The diagram shows the various caches and their location in the Snowflake Architecture.
- The Metadata cache and the Query Result cache are part of the Cloud Services Layer. Since Metadata cache and the Query Result cache are part of the cloud services layer, they are available to all virtual warehouses.
- The Virtual Warehouse cache is part of the Query Processing Layer and hence it is local to each virtual warehouse.

Since Metadata cache and the Query Result cache are part of the Cloud Services Layer, they can run without the need of an active virtual warehouse.
3. Query Result Cache
When a query is executed in Snowflake, the query results are persisted (stored) for a defined period of time. The results are purged from the system at the end of time period. The persisted query results are referred to as Query Result Cache.
The Query Result cache helps avoiding re-executing the queries when a same query is submitted by user which was previously executed and there is no change in the underlying table data.
The following conditions should be met for the query results to be reused
- First and foremost, the underlying data of the table used in the query should not have changed. If the data in any of the table used in the query have changed, the result cache cannot be used.
- The new query should syntactically match the previously-executed query.
- The query should not include functions that are evaluated at execution time (ex: CURRENT_TIMESTAMP()), user-defined functions (UDFs) or external functions.
- The persisted result for the previous query is still available.
- The table’s micro-partitions should not have changed (e.g. been reclustered).
3.1. Query Result Cache Expiry
Once the query result cache is generated for a query, it stays available for 24 hours.
The result cache expiry is extended for an additional 24 hours if a subsequent query that makes use of the query result cache is run during those 24 hours. Otherwise, after 24 hours, the query result cache is cleared.
The result cache expiry is extended up to a maximum of 31 days from the date and time the query was first executed. After 31 days, the result cache is purged and the next time the query is submitted, a new result cache is generated and persisted.
3.2. Disabling Query Result Cache
The Query Result Cache is enabled by default and can be disabled at the USER, SESSION or ACCOUNT level using USE_CACHED_RESULT session parameter as shown below.
ALTER SESSION SET USE_CACHED_RESULT = FALSE;

ALTER USER <username> SET USE_CACHED_RESULT = FALSE;
3.3. Query Result Cache Demonstration
To demonstrate Query Result Cache, let us run a query in Snowflake. We then re-run the same query to validate that the query result cache is reused and the results are displayed faster.
1. Login to Snowflake WebUI. In the worksheet, run the below SQL query which makes use of the sample data provided by Snowflake.
USE SCHEMA snowflake_sample_data.tpcds_sf10tcl;
select
i_item_sk, sum(ss_quantity) quantity
from store_sales, item
where ss_item_sk = i_item_sk
group by i_item_sk
order by i_item_sk
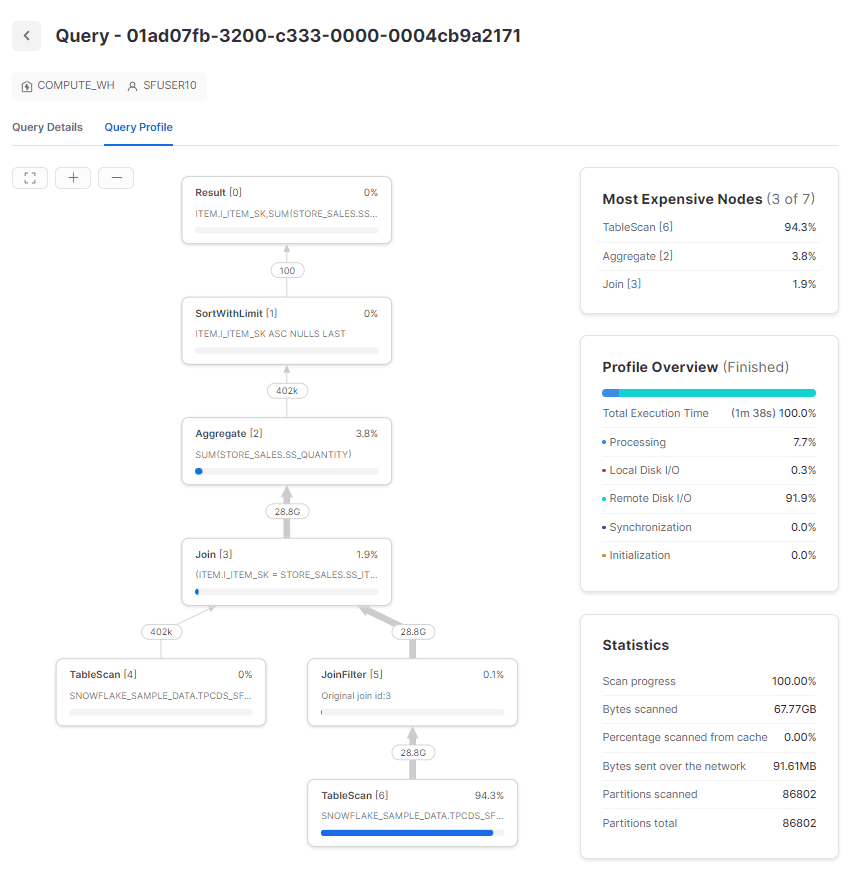
limit 100;2. After the query is complete, review the query plan of the query and note down the time taken by query to complete. The below image shows the query profile of the query executed in above step.
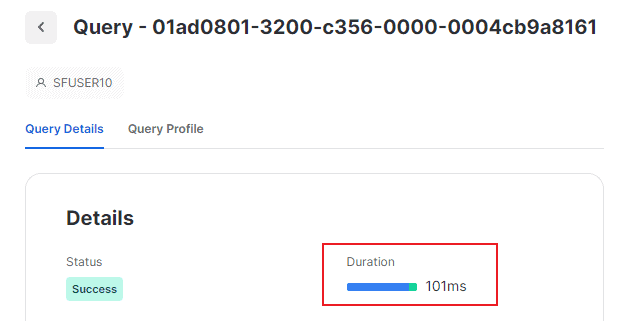
3. Rerun the same query and verify the query profile and time taken to complete. The query profile will show a single node with the message QUERY RESULT REUSE indicating that the query result cache was used.
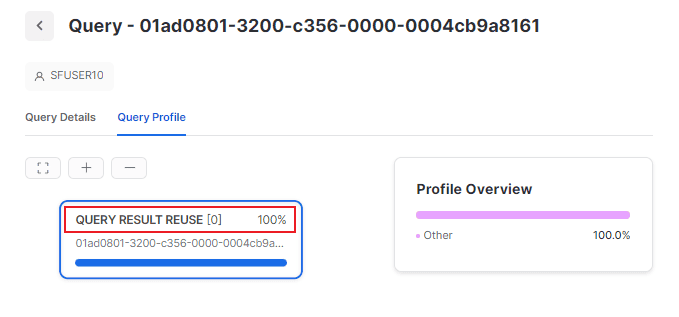
The time taken by the query will be merely few milliseconds.
4. Metadata Cache
Snowflake stores certain information about each table like row count, min/max values of a column in its metadata in the cloud services layer so that certain queries about the table can be easily answered without reading the table data. This table information stored in metadata is referred as Metadata Cache in Snowflake.
The information that Snowflake stores about each table in metadata include
- ROW COUNT of a table.
- MIN and MAX values of a column.
- Number of DISTINCT values in a column.
Note that MIN and MAX run on character columns will not use metadata cache.
4.1. Metadata Cache Expiry
Every time when data in table is either inserted, updated or deleted, new micro partitions are written and Snowflake keeps track of these changes in the metadata. Hence latest data of above discussed details of a table is always available in the metadata cache.
4.2. Metadata Cache Demonstration
To demonstrate Metadata Cache, let us run few queries and see how they are answered from metadata.
1. Login to Snowflake WebUI. In the worksheet, run the below SQL query which queries the total row count from a table.
USE SCHEMA snowflake_sample_data.tpcds_sf10tcl;

select count(*) from store_sales;
After the query is complete, review the query plan of the query and note down the time taken by query to complete. The query profile will show a single node with the message METADATA-BASED RESULT indicating that the query result was returned from metadata and time taken would be only few seconds.

2. Let us run another query which extracts min and max values of a column of type integer.
USE SCHEMA snowflake_sample_data.tpcds_sf10tcl;

select min(ss_quantity), max(ss_quantity) from store_sales;
The query profile would be same as the above example which will show a single node with the message METADATA-BASED RESULT.
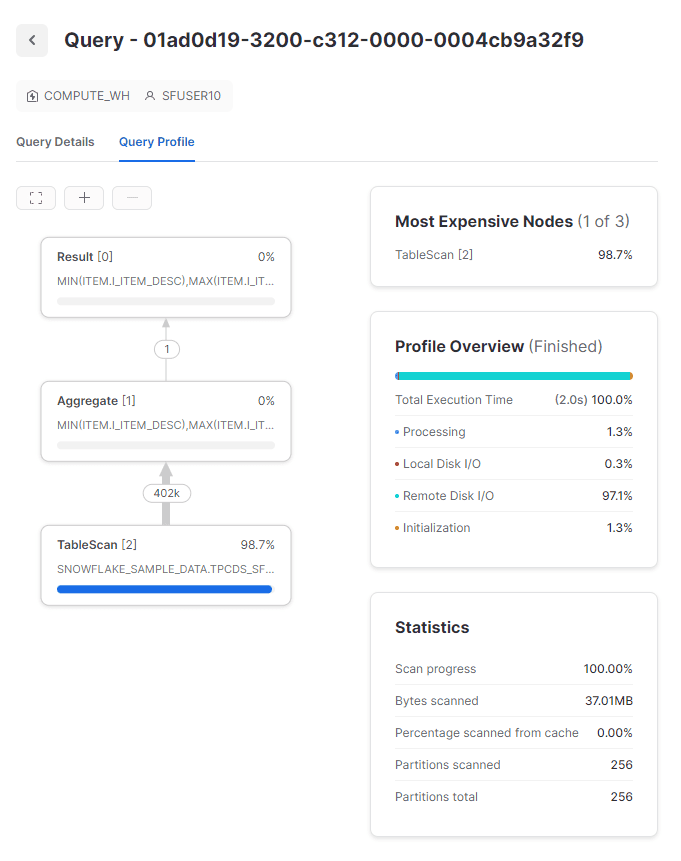
3. Let us run another query which extracts min and max values of a column of type varchar.
USE SCHEMA snowflake_sample_data.tpcds_sf10tcl;

select min(i_item_desc), max(i_item_desc) from item;
The query profile of this query will not show METADATA-BASED RESULT. Instead the query profile consists of multiple steps indicating that metadata cache is not used for extracting min and max values of character columns.
5. Virtual Warehouse Cache
Every time a virtual warehouse extracts data from a table, it caches that data locally. The subsequent queries can reuse the data in the cache rather than reading from the table in the cloud storage. This cache which gets stored at the local disk is referred to as Virtual Warehouse Cache or Local Disk Cache in Snowflake.
Reading data from a local cache is a much more efficient operation than reading data from the remote cloud storage. Therefore the warehouse cache improves performance of queries which can take advantage of it.
5.1. Virtual Warehouse Cache Expiry
The Virtual Warehouse Cache is removed if the virtual warehouse is suspended.
When the virtual warehouse is resumed, the cache is rebuilt over time as queries are processed. Therefore, it is worth analyzing if suspending a virtual warehouse gives you more cost benefit or keeping it running to have the cache improve query performance.
Note that the size of a virtual warehouse cache is dependent on the size the virtual warehouse. Bigger the virtual warehouse size, larger the cache.
5.2. Virtual Warehouse Cache Demonstration
To demonstrate Virtual Warehouse Cache, let us run few queries which are slightly close to each other and see how Virtual Warehouse Cache improves query performance.
1. Login to Snowflake WebUI. Suspend the virtual warehouse using which you are going to run your queries. This is to ensure that any existing virtual warehouse cache is cleared up.
ALTER WAREHOUSE COMPUTE_WH SUSPEND;2. In the worksheet, run the below SQL query which makes use of the sample data provided by Snowflake.
USE SCHEMA snowflake_sample_data.tpcds_sf10tcl;
select
d_year, sum(ss_ext_sales_price) sales_price
from store_sales, date_dim
where ss_sold_date_sk = date_dim.d_date_sk
and d_year = '2001' and d_qoy in ('1','2')
group by d_year
order by d_year
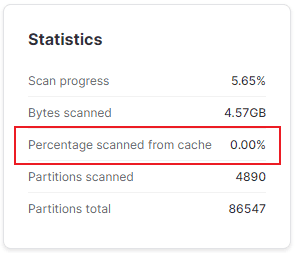
;After the query is complete, review the query plan of the query. The query profile indicates that Percentage of data scanned from cache is zero indicating that the virtual warehouse cache had no data in it initially.
3. Let us execute another query immediately. Note that the condition in the query is changed so that the query is not answered using Query Result Cache. But it is kept close enough that it can make use of the Virtual Warehouse Cache.
USE SCHEMA snowflake_sample_data.tpcds_sf10tcl;
select
d_year, sum(ss_ext_sales_price) sales_price
from store_sales, date_dim
where ss_sold_date_sk = date_dim.d_date_sk
and d_year = '2001' and d_moy in ('3','6','9','12')
group by d_year
order by d_year
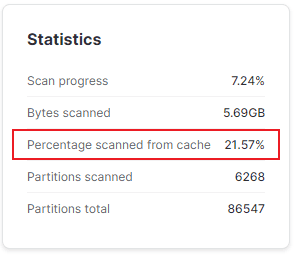
;After the query is complete, review the query plan of the query. The query profile indicates that almost 22% of data is scanned from cache indicating that the virtual warehouse cache is reused.
4. Let us suspend the virtual warehouse and run a slightly different query. Note that suspending the warehouse results in existing virtual warehouse cache to be purged.
ALTER WAREHOUSE COMPUTE_WH SUSPEND;
USE SCHEMA snowflake_sample_data.tpcds_sf10tcl;
select
d_year, sum(ss_ext_sales_price) sales_price
from store_sales, date_dim
where ss_sold_date_sk = date_dim.d_date_sk
and d_year = '2001' and d_moy in ('4','5','6')
group by d_year
order by d_year
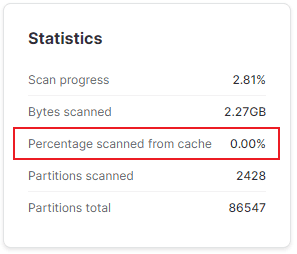
;After the query is complete, review the query plan of the query. The query profile indicates that Percentage of data scanned from cache is zero indicating that the no virtual warehouse cache is used after suspending the warehouse.
This concludes the demonstration of various cache in Snowflake and how they are utilized to improve the query performance.
Subscribe to our Newsletter !!
Related Articles:
A step by step guide on automating continuous data loading into Snowflake through Snowpipe on Microsoft Azure.

A step by step guide on automating continuous data loading into Snowflake through Snowpipe on AWS S3.

Learn how to load files from external storage using the Snowpipe and monitor the load status of the files in Snowflake.