1. Introduction
Snowflake continues to enhance its observability and operational monitoring features, and Event Tables are a powerful addition to that suite. Unlike traditional logging methods, Event tables enable the capture of detailed logs and event data for structured, scalable mechanism to capture diagnostic data across Snowflake workloads, including stored procedures, user-defined functions (UDFs), and more.
This article walks through what event tables are, how to set them up, manage logging levels, and query event data effectively.
2. What are Event Tables in Snowflake?
Event Tables in Snowflake are specialized tables used to collect telemetry data (logs, traces, and events) emitted by Snowflake components like stored procedures, UDFs.
- By default, Snowflake uses the built-in snowflake.telemetry.events table as the account-level event table.
- The table contains the predefined set of columns, which can’t be modified.
- A custom event table can also be created and assigned to the account
- Each Snowflake account can have only one event table assigned at a time.
The following command displays the event table currently assigned at the account level.
SHOW PARAMETERS LIKE 'event_table' IN ACCOUNT;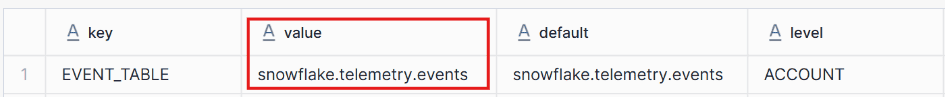
3. How to Create and Manage Event Tables in Snowflake?
It is highly recommended to create and assign a custom event table for production use, as it offers enhanced control and flexibility.
Key benefits include:
- Support for row access policies
- Isolated logging by team or environment
- Improved governance and cost tracking
The following steps explain how to create and enable event table for your account
3.1. Create Event Table
Use the following command to create a custom event table.
CREATE OR REPLACE EVENT TABLE EVENTS_DB.TELEMETRY.my_event_table;There is no need to specify the table columns, as it comes with a predefined set of columns.
3.2. Assign the Event Table to the Account
To use a custom event table, it must be assigned at the account level. This can only be done using the ACCOUNTADMIN role:
ALTER ACCOUNT SET EVENT_TABLE = EVENTS_DB.TELEMETRY.my_event_table;The assignment can be verified using below statement.
SHOW PARAMETERS LIKE 'event_table' IN ACCOUNT;
3.3. Set the Log Level
To capture logs from stored procedures or UDFs, the log level must be explicitly configured. Log levels determine the verbosity of logs recorded and can be set at various scopes: account, database, schema, session or object.
The LOG_LEVEL parameter controls the granularity of logging. It accepts the following levels, listed in order of decreasing verbosity:
TRACE > DEBUG > INFO > WARN > ERROR > FATALHigher verbosity levels include messages from all levels below them. For instance, setting the log level to TRACE will capture logs of all types.
This setting requires the ACCOUNTADMIN role or delegated privileges.
USE ROLE ACCOUNTADMIN;

ALTER DATABASE my_db SET LOG_LEVEL = ERROR;

ALTER SCHEMA my_db.my_session SET LOG_LEVEL = ERROR;
3.4. Log Messages in Stored Procedures
3.4.1. Working with SQL Stored Procedures
Snowflake provides the SYSTEM$LOG function to log messages from SQL stored procedures at various levels. Below is an example procedure:
CREATE OR REPLACE PROCEDURE SP_EVENT_LOG_DEMO()
RETURNS STRING
LANGUAGE SQL
AS
BEGIN
    SYSTEM$LOG('TRACE', 'This is a sample TRACE log');
    SYSTEM$LOG('DEBUG', 'This is a sample DEBUG log');
    SYSTEM$LOG('INFO',  'This is a sample INFO log');
    SYSTEM$LOG('WARN',  'This is a sample WARN log');
    SYSTEM$LOG('ERROR', 'This is a sample ERROR log');
    SYSTEM$LOG('FATAL', 'This is a sample FATAL log');

    RETURN 'Success';
END;
After the procedure is created, the LOG_LEVEL can also be assigned at the object level.
USE ROLE ACCOUNTADMIN;

ALTER PROCEDURE SP_EVENT_LOG_DEMO() SET LOG_LEVEL = TRACE;
The log level set at the object level takes precedence over broader scopes.
For example, if the account-level log level is set to ERROR, but the specific stored procedure object has a log level of TRACE, then all logs from TRACE and above will still be captured, due to the object-level override.
3.4.2. Working with Python Stored Procedures
Logging in Python stored procedures uses standard Python logging mechanisms. These logs can be captured in the event table when the appropriate log level is set. Here is a sample:
CREATE OR REPLACE PROCEDURE SP_PY_EVENT_LOG_DEMO()
RETURNS VARCHAR
LANGUAGE PYTHON
PACKAGES = ('snowflake-snowpark-python')
RUNTIME_VERSION = 3.11
HANDLER = 'main'
AS
$$
import logging

logger = logging.getLogger("python_logger")

def main(session):
    logger.debug('This is a sample DEBUG log in Python SP')
    logger.info('This is a sample INFO log in Python SP')
    logger.warn('This is a sample WARN log in Python SP')
    logger.error('This is a sample ERROR log in Python SP')
    logger.fatal('This is a sample FATAL log in Python SP')

    return "SUCCESS"
$$;
Logging in Python procedures enables developers to trace and troubleshoot logic within the script, and these logs will be captured in the event table if the configured log level allows it.
3.4. Querying the Event Table
The event logs can be analyzed using simple SQL queries for troubleshooting or audit purposes. Example:
SELECT
TIMESTAMP,
RECORD,
RECORD_ATTRIBUTES,
VALUE AS LOG_MESSAGE
FROM EVENTS_DB.TELEMETRY.my_event_table
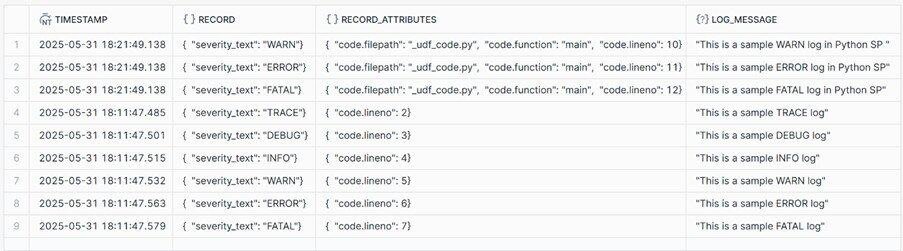
WHERE RECORD_TYPE = 'LOG';The following is the output from querying the event table.
- TIMESTAMP: When the event was recorded
- RECORD: JSON block containing event details
- RECORD_ATTRIBUTES: Metadata like log level, source, log line number
- VALUE: The log message itself
The event logs can be filtered, joined, or aggregated just like any other table to support operational dashboards or alerting systems.
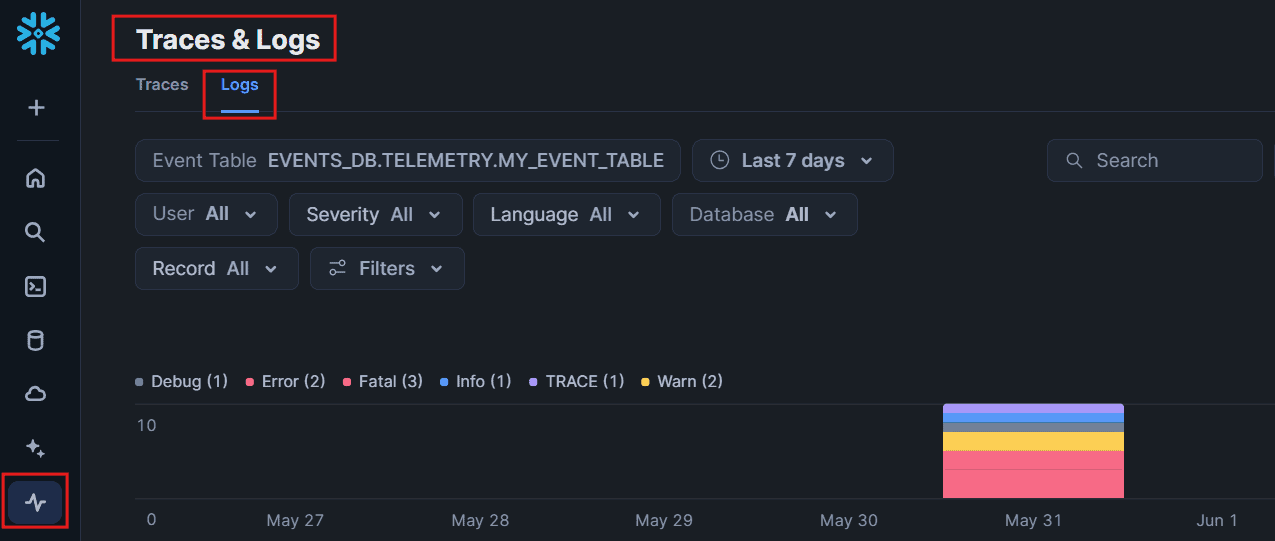
3.5. Monitoring Event Logs from Snowsight
Event logs can also be monitored from Snowsight UI directly.
- Navigate to Monitoring > Traces & Logs > Logs
- Apply filters such as log level, object name, or time window to isolate relevant events
4. Event Tables Pricing and Billing
The Log events are captured as a serverless feature in Snowflake, so they don’t consume any of your virtual warehouse credits. The following query helps monitor the usage and cost associated with event tables.
SELECT
    start_time,
    end_time,
    credits_used,
    bytes_ingested
FROM snowflake.account_usage.EVENT_USAGE_HISTORY
ORDER BY start_time DESC;
This provides visibility into how much storage and compute your event logging is consuming.
5. Limitations
Event tables are append-only and cannot be cloned. Individual rows cannot be updated. However, the following operations are supported:
- SHOW EVENT TABLE
- DESCRIBE EVENT TABLE
- DROP TABLE
- UNDROP TABLE
- TRUNCATE TABLE
- DELETE
- ALTER TABLE(limited control)
6. Summary
Event Tables in Snowflake provide a scalable and flexible approach for logging and system monitoring.
Key takeaways:
- Custom event tables are recommended for production environments for better control and governance.
- Log levels determine the verbosity of logs and can be set at multiple scopes.
- SQL stored procedures can log messages using SYSTEM$LOG. Python stored procedures can use standard logging modules.
- Event logs can be queried like any other table and viewed in Snowsight.
- Billing insights can be monitored using the EVENT_USAGE_HISTORY view.
- While event tables are append-only, they support common DDL operations like TRUNCATE, DELETE, and DROP.
By configuring event tables properly, teams can enhance visibility into Snowflake workloads, making it easier to debug issues, audit actions, and ensure system health.
Subscribe to our Newsletter !!
Related Articles:
- Snowflake Micro-partitions & Data Clustering
- Snowflake File Formats
- Types of Snowflake Tables
- Types of Views in Snowflake
- Types of Snowflake Stages: Data Loading and Unloading Features
- HOW TO: Create External Stages in Snowflake
- HOW TO: Create Snowflake External Tables?
- HOW TO: Load and Query JSON data in Snowflake?
- INSERT and Multi-Table Inserts in Snowflake
- HOW TO: Create Snowflake Iceberg Tables?
- Creating Snowflake Iceberg tables using AWS Glue as Catalog
- Data Load using COPY INTO Command in Snowflake
- Data Unloading using COPY INTO Command in Snowflake
- Snowflake Directory Tables: Query and Manage Staged Files
- Snowflake File URLs: Securely Access and Share Staged Files