
1. Write a SQL Query to generate Cricket match fixtures for Asia Cup.
Source:
The Source table Teams consists of a single column Country which consists of the list of countries participating in Asia cup.
CREATE TABLE TEAMS(
   COUNTRY VARCHAR(50)
);

INSERT INTO TEAMS VALUES('India');
INSERT INTO TEAMS VALUES('Srilanka');
INSERT INTO TEAMS VALUES('Bangladesh');
INSERT INTO TEAMS VALUES('Pakistan');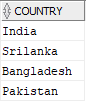
Expected Output:
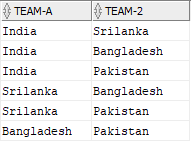
The output should provide the possible match fixtures between all the teams participating in Asia cup.
Solution:
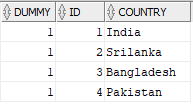
In order to generate the fixtures between the various teams we have to do a self join on source table Teams. We need to add additional fields which helps in the self join as below.
- A Dummy field which acts as a common field to perform self join of the table.(optional)
- An unique ID assigned for each country which helps in removing duplicate fixtures.
SELECT
   1 AS DUMMY,
   CASE
      WHEN COUNTRY = 'India' THEN 1
      WHEN COUNTRY = 'Srilanka' THEN 2
      WHEN COUNTRY = 'Bangladesh' THEN 3
      WHEN COUNTRY = 'Pakistan' THEN 4
   ELSE 0 END AS ID,
   COUNTRY
 FROM TEAMS;
The output of the above query will be as below:
Perform a self join on table TEAMS based on Dummy and ID fields as shown in below query to get the expected output.
WITH TEAM AS(
SELECT 1 AS DUMMY,
CASE
WHEN COUNTRY = 'India' THEN 1
WHEN COUNTRY = 'Srilanka' THEN 2
WHEN COUNTRY = 'Bangladesh' THEN 3
WHEN COUNTRY = 'Pakistan' THEN 4
ELSE 0 END AS ID,
COUNTRY
FROM TEAMS
)
SELECT
t1.COUNTRY "TEAM-A",
t2.COUNTRY "TEAM-B"
FROM TEAM t1 JOIN TEAM t2
ON t1.DUMMY = t2.DUMMY
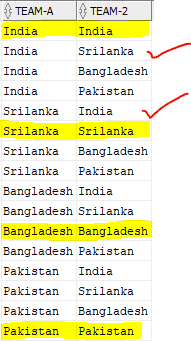
AND t1.ID < t2.ID;If we do not include the join condition based on ID, the output will be as shown below causing duplication of fixtures and also creating matches where a team plays against itself. The Dummy field helps in creating a cartesian output and the ID field helps in filtering the duplicates.
2. Write a SQL Query to find the number of matches played, won, lost and tied by each team in Asia cup.
Source:
The Source table Match_Results consists of the results of matches played in Asia Cup.
CREATE TABLE MATCH_RESULTS(
   TEAM_A VARCHAR(10),
   TEAM_B VARCHAR(10),
   RESULT VARCHAR(10)
);

INSERT INTO MATCH_RESULTS VALUES('India','Bangladesh','India');
INSERT INTO MATCH_RESULTS VALUES('India','Pakistan','India');
INSERT INTO MATCH_RESULTS VALUES('India','Srilanka','');
INSERT INTO MATCH_RESULTS VALUES('Srilanka','Bangladesh','Srilanka');
INSERT INTO MATCH_RESULTS VALUES('Srilanka','Pakistan','Pakistan');
INSERT INTO MATCH_RESULTS VALUES('Bangladesh','Pakistan','Bangladesh');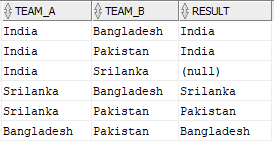
Expected Output:
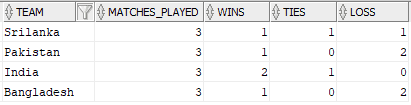
The output should contain the number of matches played, won, lost and tied for each team as shown below.
Solution:
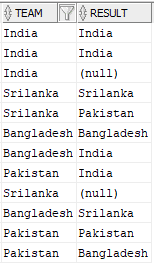
First list the details of teams played in a match along with the result of the match from the source table. In order to achieve this, we need to select the Team_A along with result and select Team_B along with result separately and join them using UNION ALL set operator. The output of the query will be as below.
In order to get the number of matches played by a team, take the count of each team from above output using GROUP BY function on field team. And for a particular team, the sum of number of its own entries in result field gives the Wins and sum of number of times a different country in the result field gives Losses for that country. When the result is null, the sum of those entries gives Ties count of that country.
The final output query will be as below:
WITH MATCHES AS
(
   SELECT TEAM_A AS TEAM, RESULT FROM Match_Results
   UNION ALL
   SELECT TEAM_B AS TEAM, RESULT FROM Match_Results
)
SELECT
   TEAM,
   COUNT(TEAM)  MATCHES_PLAYED,
   SUM(CASE WHEN RESULT = TEAM THEN 1 ELSE 0 END)  WINS,
   SUM(CASE WHEN RESULT IS NULL THEN 1 ELSE 0 END)  TIES,
   SUM(CASE WHEN RESULT != TEAM THEN 1 ELSE 0 END)  LOSS
FROM MATCHES
GROUP BY TEAM;
3. Write a SQL Query to find Min and Max values of continuous sequence in a group of elements.
Source:
The Source table Elements consists of two fields one with details of an Element and the other with a Sequence associated to the element.
CREATE TABLE ELEMENTS(
   ELEMENT VARCHAR2(10),
   SEQUENCE NUMBER
);

INSERT INTO ELEMENTS VALUES('A','1');
INSERT INTO ELEMENTS VALUES('A','2');
INSERT INTO ELEMENTS VALUES('A','3');
INSERT INTO ELEMENTS VALUES('A','5');
INSERT INTO ELEMENTS VALUES('A','6');
INSERT INTO ELEMENTS VALUES('A','8');
INSERT INTO ELEMENTS VALUES('A','9');
INSERT INTO ELEMENTS VALUES('B','11');
INSERT INTO ELEMENTS VALUES('C','13');
INSERT INTO ELEMENTS VALUES('C','14');
INSERT INTO ELEMENTS VALUES('C','15');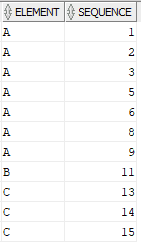
Expected Output:
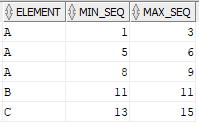
The output should capture the element and the minimum and maximum of continuous sequence available for the element in the source table as shown below. In the source data, the first three rows have a continuous sequence where the difference between consecutive rows is one. The sequence is broken from the fourth row. So the first three rows must be captured in a single row with element as A and the minimum and maximum sequence values as 1 and 3. Such continuous sequence patterns present in the entire source data must be captured.
Solution:
Step-1:
Add a continuous sequence for each element using ROW_NUMBER analytic function as a separate field.
SELECT
   ELEMENT,
   SEQUENCE,
   ROW_NUMBER() OVER(PARTITION BY ELEMENT ORDER BY SEQUENCE) AS ELEMENT_SEQ
FROM ELEMENTS;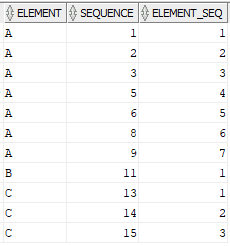
Step-2:
Substract the sequence of each element from the generated continuous sequence. This difference value from the subtraction will be equal for the continuous sequence values as shown below.
WITH TEMP AS(
SELECT
   ELEMENT,
   SEQUENCE,
   ROW_NUMBER() OVER(PARTITION BY ELEMENT ORDER BY SEQUENCE) AS ELEMENT_SEQ
FROM ELEMENTS
)
SELECT
   ELEMENT,
   SEQUENCE,
   ELEMENT_SEQ,
   (SEQUENCE - ELEMENT_SEQ) AS DIFF
FROM TEMP;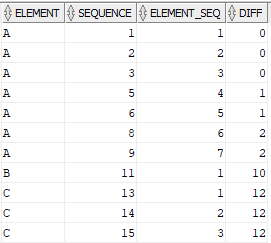
Step-3:
In the final step, select the min and max of Sequence values of an element by grouping them on Element and the Difference value. The final query will be as below.
WITH TEMP AS(
SELECT
ELEMENT,
SEQUENCE,
ROW_NUMBER() OVER(PARTITION BY ELEMENT ORDER BY SEQUENCE) AS ELEMENT_SEQ
FROM ELEMENTS
)
,TEMP2 AS(
SELECT
ELEMENT,
SEQUENCE,
ELEMENT_SEQ,
(SEQUENCE - ELEMENT_SEQ) AS DIFF
FROM TEMP
)
SELECT
ELEMENT,
MIN(SEQUENCE) AS MIN_SEQ,
MAX(SEQUENCE) AS MAX_SEQ
FROM TEMP2
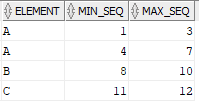
GROUP BY ELEMENT,DIFF;4. Write a SQL Query to find start and end values of a continuous sequence of an Element.
Source:
The Source table Element consists of three fields, one with details of an Element and the other two with a start and end sequence values to the element. The problem is similar to the one discussed in previous question. The difference is that the element is provided with a start and end sequence in the same row. The difference between the start and end sequence fields in a row is always one.
CREATE TABLE ELEMENT(
   ELEMENT VARCHAR2(10),
   START_SEQ NUMBER,
   END_SEQ NUMBER
);

INSERT INTO ELEMENT VALUES('A','1','2');
INSERT INTO ELEMENT VALUES('A','2','3');
INSERT INTO ELEMENT VALUES('A','4','5');
INSERT INTO ELEMENT VALUES('A','5','6');
INSERT INTO ELEMENT VALUES('A','6','7');
INSERT INTO ELEMENT VALUES('B','8','9');
INSERT INTO ELEMENT VALUES('B','9','10');
INSERT INTO ELEMENT VALUES('C','11','12');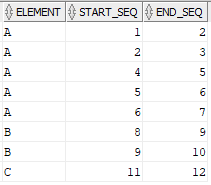
Expected Output:
The output should capture the element and the minimum and maximum of continuous sequence available for the element from start_seq and end_seq fields in the source table as shown below. In the source data, the end value of first row is start value of second row. This pattern helps in linking the two rows. Identify such patterns and find the start and end values of the sequence.
Solution:
The process is similar to what we have discussed in the earlier problem. The difference is, in the previous problem, the sequence of an element is provided in a single column where as the in the current problem, the sequence of an element is provided using two different fields in a single row.
- In step-1, add a continuous sequence for each element using ROW_NUMBER analytic function as a separate field.
- In step-2, find the difference between start_seq and the generated continuous sequence field. This difference value will be equal for the rows with continuous start_seq values.
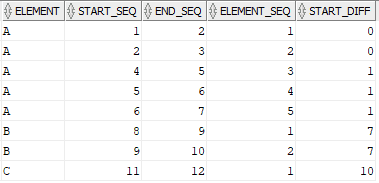
- In the final step, select the min of start_seq and max of end_seq fields of an element by grouping them on Element and the Difference value. The final query will be as below.
WITH TEMP AS(
SELECT
   ELEMENT, START_SEQ, END_SEQ,
   ROW_NUMBER() OVER(PARTITION BY ELEMENT ORDER BY START_SEQ,END_SEQ) AS ELEMENT_SEQ
FROM ELEMENT
)
,TEMP2 AS(
SELECT
   ELEMENT, START_SEQ, END_SEQ,
   (START_SEQ - ELEMENT_SEQ) AS START_DIFF
FROM TEMP
)
SELECT
   ELEMENT,
   MIN(START_SEQ) AS MIN_SEQ,
   MAX(END_SEQ) AS MAX_SEQ
FROM TEMP2
GROUP BY ELEMENT,START_DIFF
ORDER BY ELEMENT;
5. Write a SQL Query to find Start_date and End_date when there is a constant Balance amount for continuous Dates.
Source:
The source table Balances consists of two fields, Dates which store the date value and Balance which store the balance amount details corresponding to the Date.
CREATE TABLE BALANCES(
   BALANCE NUMBER,
   DATES DATE
);

INSERT INTO BALANCES VALUES('26000','2020-01-01');
INSERT INTO BALANCES VALUES('26000','2020-01-02');
INSERT INTO BALANCES VALUES('26000','2020-01-03');
INSERT INTO BALANCES VALUES('30000','2020-01-04');
INSERT INTO BALANCES VALUES('30000','2020-01-05');
INSERT INTO BALANCES VALUES('26000','2020-01-06');
INSERT INTO BALANCES VALUES('26000','2020-01-07');
INSERT INTO BALANCES VALUES('32000','2020-01-08');
INSERT INTO BALANCES VALUES('31000','2020-01-09');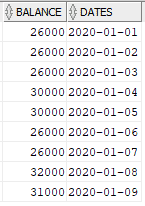
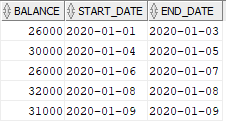
Expected Output:
The output should capture the start and end dates where the balance amount remains constant over a continuous days. In the source, the balance amount remains constant as 26000 from Jan-1st till Jan-3rd over three continuous days. So, this data must be captured in a row with Jan-1st as Start_Date and Jan-3rd as End_Date where Balance amount is 26000.
Solution:
The problem is again similar to the previous problems discussed in Q3 and Q4 but presented in a different way. The Balance field represents the Element and the Dates represent the sequence.
- Create two fields. One which provides the continuous sequence value based on balance(refer Ranking field value for balance 26000). Other one which give the sequence value based on the order of dates(refer Date_Rank field value).
- Calculate the difference of both the fields. This difference value will be equal for all the dates where the balance amount is same.
SELECT
   BALANCE,
   DATES,
   ROW_NUMBER() OVER(ORDER BY DATES ) AS DATE_RANK,
   ROW_NUMBER() OVER(PARTITION BY BALANCE ORDER BY DATES) RANKING,
   ROW_NUMBER() OVER(ORDER BY DATES ) - ROW_NUMBER()OVER(PARTITION BY BALANCE ORDER BY DATES) DIFF
FROM BALANCES ORDER BY DATES;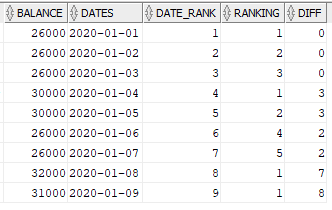
Select the min and max Date values for a Balance amount by grouping them on Balance and the Difference value. The final output query will be as below:
WITH TEMP AS
(
SELECT
   BALANCE,
   DATES,
   ROW_NUMBER() OVER(ORDER BY DATES ) AS DATE_RANK,
   ROW_NUMBER() OVER(PARTITION BY BALANCE ORDER BY DATES) RANKING,
   ROW_NUMBER() OVER(ORDER BY DATES ) - ROW_NUMBER()OVER(PARTITION BY BALANCE ORDER BY DATES) DIFF
FROM BALANCES ORDER BY DATES
)
SELECT
   BALANCE,
   MIN(DATES) AS START_DATE,
   MAX(DATES) AS END_DATE
FROM TEMP
GROUP BY BALANCE,DIFF;
6. Write a SQL Query to Denormalize the student data by converting rows into columns.
Source:
The Source table Students stores student’s mark details for each subject. The table contains student ID, Name, subject and marks scored in the subject by the student.
CREATE TABLE STUDENTS(
   ID number,
   NAME varchar(10),
   SUBJECT varchar(10),
   SCORE number
);

INSERT INTO STUDENTS VALUES('1','Ram','Maths','50');
INSERT INTO STUDENTS VALUES('1','Ram','Physics','65');
INSERT INTO STUDENTS VALUES('1','Ram','Chemistry','70');
INSERT INTO STUDENTS VALUES('2','Neena','Maths','88');
INSERT INTO STUDENTS VALUES('2','Neena','Physics','90');
INSERT INTO STUDENTS VALUES('2','Neena','Chemistry','65');
INSERT INTO STUDENTS VALUES('3','John','Maths','100');
INSERT INTO STUDENTS VALUES('3','John','Physics','45');
INSERT INTO STUDENTS VALUES('3','John','Chemistry','52');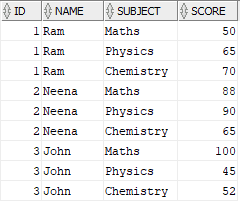
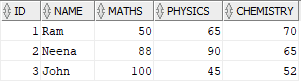
Expected Output:
The output should Denormalize the data converting the rows into columns creating a single record for each student showing marks scored in all subjects.
Solution:
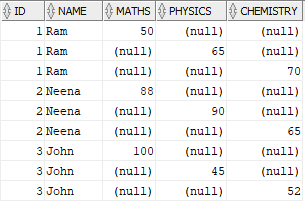
The source does not contains columns Maths, Physics and Chemistry which are expected in the final output. So these columns needs to be created using a case statement.
SELECT
   ID,
   NAME,
   CASE WHEN Subject = 'Maths' THEN Score ELSE null END AS Maths,
   CASE WHEN Subject = 'Physics' THEN Score Else null END AS Physics,
   CASE WHEN Subject = 'Chemistry' THEN Score Else null END AS Chemistry
FROM Students;
The output of the above query is as shown below. The output still consists of same number of rows as source with newly created fields where Score for each subject is present in only one row with rest of the subject scores as NULL.
To combine all the records of a student into a single record, select max of score for each subject grouping by ID and Name. The final query will be as below.
SELECT
   a.ID,
   a.NAME,
   MAX(a.Maths) AS Maths,
   MAX(a.Physics) AS Physics,
   MAX(a.Chemistry) AS Chemistry
FROM(
   SELECT
      ID,
      NAME,
      CASE WHEN Subject = 'Maths' THEN Score ELSE null END AS Maths,
      CASE WHEN Subject = 'Physics' THEN Score Else null END AS Physics,
      CASE WHEN Subject = 'Chemistry' THEN Score Else null END AS Chemistry
   FROM Students) a
GROUP BY ID, NAME;
The alternate solution to Denormalize data using the PIVOT function in oracle is as below
SELECT * FROM Students
PIVOT (MAX(Score) FOR Subject IN ('Maths' AS Maths, 'Physics' AS Physics,'Chemistry' AS Chemistry))
ORDER BY ID;
7. Write a SQL Query to find Student details who scored marks greater than equal to previous year.
Source:
The Source table Student_Marks contains marks scored by students across three different years. The table contains fields Student_Name, Total_Marks scored and Year in which marks are scored.
CREATE TABLE STUDENT_MARKS(
   STUDENT_NAME VARCHAR(50),
   TOTAL_MARKS NUMBER,
   YEAR NUMBER(4)
);

INSERT INTO STUDENT_MARKS VALUES('Ram','90','2010');
INSERT INTO STUDENT_MARKS VALUES('Neena','80','2010');
INSERT INTO STUDENT_MARKS VALUES('John','70','2010');
INSERT INTO STUDENT_MARKS VALUES('Ram','90','2011');
INSERT INTO STUDENT_MARKS VALUES('Neena','85','2011');
INSERT INTO STUDENT_MARKS VALUES('John','65','2011');
INSERT INTO STUDENT_MARKS VALUES('Ram','80','2012');
INSERT INTO STUDENT_MARKS VALUES('Neena','80','2012');
INSERT INTO STUDENT_MARKS VALUES('John','90','2012');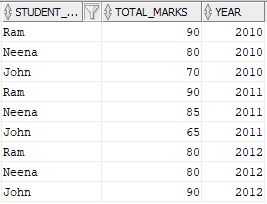
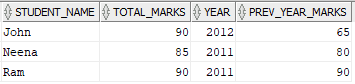
Expected Output:
The output should contain the details of students who scored greater than or equal to previous year. For example, John scored 90 marks in 2012, 65 marks in 2011 and 70 marks in 2010. Since he scored more marks in 2012 compared to 2011, these details are expected in output.
Solution:
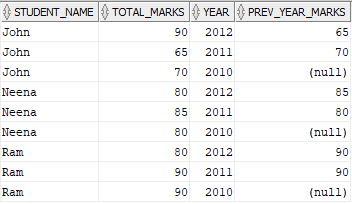
In order to compare current year marks with previous year marks, we will be using LEAD Analytic function. The LEAD function helps in fetching the previous year marks in the current year record.
SELECT
   a.*,
   LEAD(TOTAL_MARKS) OVER(PARTITION BY STUDENT_NAME ORDER BY STUDENT_NAME, YEAR DESC) AS PREV_YEAR_MARKS
FROM STUDENT_MARKS a;
The output of the above query which fetches the marks of the previous year is as below
Once we are able to read the previous year marks in the current year record, filter records by adding the condition Total_Marks > Prev_Year_Marks in the where condition. The final output query will be as below.
WITH TEMP AS(
SELECT
   a.*,
   LEAD(TOTAL_MARKS) OVER(PARTITION BY STUDENT_NAME ORDER BY STUDENT_NAME, YEAR DESC) AS PREV_YEAR_MARKS
FROM STUDENT_MARKS a
)
SELECT * FROM TEMP WHERE TOTAL_MARKS >= PREV_YEAR_MARKS;
Alternate Solution:
The required output can also be fetched by doing a self join on Student_Marks table. The join condition should be based on Student_Name and Year = Year+1. Thus a record joins with previous year and the marks fetched from the latter would become previous year marks. The same filter condition can be applied in Where clause to fetch student details who scored more marks in current year than previous year.
SELECT
  a.STUDENT_NAME,
  a.TOTAL_MARKS,
  a.YEAR,
  b.TOTAL_MARKS AS PREV_YEAR_MARKS
FROM STUDENT_MARKS a
JOIN STUDENT_MARKS b
ON a.STUDENT_NAME = b.STUDENT_NAME
AND a.YEAR = b.YEAR + 1
WHERE a.TOTAL_MARKS >= b.TOTAL_MARKS;
8. Write a SQL Query to find Total Sales Amount in USD for each sales date.
Source:
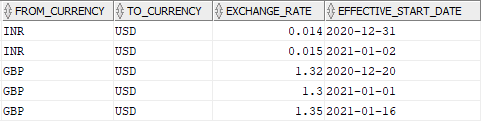
There are two source tables Sales and Exchange_Rates. The Sales table stores the data of total sales amount on a day per currency type. The Exchange_Rates table stores the exchange rate conversion value from various currencies to USD with an effective start date from when the exchange rates are applicable.
CREATE TABLE SALES(
   SALES_DATE DATE,
   SALES_AMOUNT NUMBER,
   CURRENCY VARCHAR(10)
);

INSERT INTO SALES VALUES('2021-01-01','500','INR');
INSERT INTO SALES VALUES('2021-01-01','100','GBP');
INSERT INTO SALES VALUES('2021-01-02','1000','INR');
INSERT INTO SALES VALUES('2021-01-02','500','GBP');
INSERT INTO SALES VALUES('2021-01-03','500','INR');
INSERT INTO SALES VALUES('2021-01-17','200','GBP');

CREATE TABLE EXCHANGE_RATES(
   FROM_CURRENCY VARCHAR(10),
   TO_CURRENCY VARCHAR(10),
   EXCHANGE_RATE DECIMAL(10,4),
   EFFECTIVE_START_DATE DATE
);

INSERT INTO EXCHANGE_RATES VALUES ('INR','USD','0.014','2020-12-31');
INSERT INTO EXCHANGE_RATES VALUES ('INR','USD','0.015','2021-01-02');
INSERT INTO EXCHANGE_RATES VALUES ('GBP','USD','1.32','2020-12-20');
INSERT INTO EXCHANGE_RATES VALUES ('GBP','USD','1.30','2021-01-01');
INSERT INTO EXCHANGE_RATES VALUES ('GBP','USD','1.35','2021-01-16');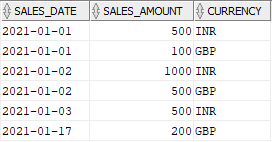
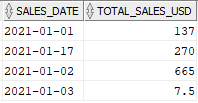
Expected Output:
The output should contain the total sales amount on day in USD. For example, on Jan-1st, the total sales amount in INR is 500 and the corresponding exchange rate on the day is 0.014. Similarly the total sales amount in GBP is 100 and the corresponding exchange rate value on Jan-1st is 1.3
The total sales on Jan-1st in USD = (500 * 0.014) + (100 * 1.3) = 7 + 130 = 137
Solution:
The Exchange_Rates table consists of effective start date of an exchange rate value but do not include the effective end date. For INR, the effective start date for exchange rate value 0.014 starts on Dec-31st. We can derive that this value is applicable until Jan-1st though it is not specified as the exchange rate value is modified from Jan-2nd. Similarly there is no effective end date specified for exchange rate value 0.015 which is effective from Jan-2nd. So for any INR value from Jan-2nd, the exchange rate value will be 0.015.
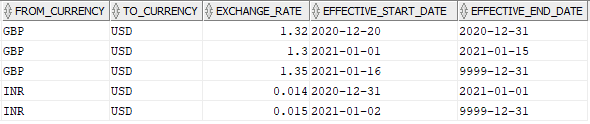
In order to simplify the process to select the exchange rate value of a currency on any day, add a new field which gives the effective end date of the exchange rate value.
To achieve this, we will be using LEAD Analytic function which gives the effective start date value of next record in the current record. The effective end date then becomes the effective start date of previous record minus one day. Since the final record of any currency will not have any value for effective end date, we will be using the NVL function to default the value as ‘9999-12-31’.
SELECT
   FROM_CURRENCY,
   TO_CURRENCY,
   EXCHANGE_RATE,
   EFFECTIVE_START_DATE,
   NVL(LEAD(EFFECTIVE_START_DATE-1) OVER(PARTITION BY FROM_CURRENCY ORDER BY EFFECTIVE_START_DATE),'9999-12-31') AS EFFECTIVE_END_DATE
FROM EXCHANGE_RATES;
The output of the above query which calculates the Effective_End_Date is as below:
Once the effective end date of a currency is calculated, join this result with source table Sales based on currency and the Sales_Date must be between the effective start and end dates. Calculate the total sales value in USD by multiplying the Sales_Amount with Exchange_Rate. The sum of total sales grouped by Sales_Date give the final total sales in USD per day.
The final output query will be as below:
WITH ER AS(
SELECT
   FROM_CURRENCY,
   TO_CURRENCY,
   EXCHANGE_RATE,
   EFFECTIVE_START_DATE,
   NVL(LEAD(EFFECTIVE_START_DATE-1) OVER(PARTITION BY FROM_CURRENCY ORDER BY EFFECTIVE_START_DATE),'9999-12-31') AS EFFECTIVE_END_DATE
FROM EXCHANGE_RATES
)
SELECT
   a.SALES_DATE,
   SUM(a.SALES_AMOUNT*b.EXCHANGE_RATE) AS TOTAL_SALES_USD
FROM  SALES a JOIN ER b
ON a.CURRENCY = b.FROM_CURRENCY
AND a.SALES_DATE BETWEEN b.EFFECTIVE_START_DATE AND b.EFFECTIVE_END_DATE
GROUP BY SALES_DATE;
9. Write a SQL Query to find missing numbers in a series.
Source:
The Source table Numbers consists of a list of numbers in ascending order.
CREATE TABLE NUMBERS(
   ID NUMBER
);

INSERT INTO NUMBERS VALUES(1);
INSERT INTO NUMBERS VALUES(4);
INSERT INTO NUMBERS VALUES(7);
INSERT INTO NUMBERS VALUES(9);
INSERT INTO NUMBERS VALUES(12);
INSERT INTO NUMBERS VALUES(14);
INSERT INTO NUMBERS VALUES(16);
INSERT INTO NUMBERS VALUES(17);
INSERT INTO NUMBERS VALUES(20);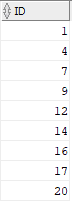
Expected Output:
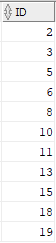
The output should contain the missing numbers in the series of numbers present in the source. For example, the first and second records in the source table are 1 and 4. So the numbers 2 and 3 are missing in the series and they must be captured in the output. Similarly the numbers 5 and 6 are missing between second and third record which must be included in the output.
Solution:
In order to find the missing numbers in a series of numbers, let us begin by generating the entire sequence of numbers using the START and END numbers in the series as anchor. This can be achieved by recursively looping from the START number until END using Recursive WITH clause statement.
The recursive WITH clause consists of two query blocks combined by UNION ALL set operator. The Anchor block queries the minimum start value of the series. The Recursive block successively add the rest of numbers until it reaches the maximum number in the series.
The Anchor block cannot reference the query name( RECURSIVE_TEMP in our example) where as the Recursive block must reference the query name atleast once.
WITH RECURSIVE_TEMP(ID) AS(
--Anchor Block
SELECT MIN(ID) AS ID FROM NUMBERS
UNION ALL
--Recursive Block
SELECT ID+1 AS ID FROM RECURSIVE_TEMP WHERE ID < (SELECT MAX(ID) AS ID FROM NUMBERS )
)
SELECT ID FROM RECURSIVE_TEMP
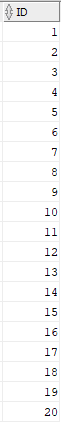
;The output of the above query is as below consisting of all numbers in a series from start till end.
Use the MINUS operator to get only the missing numbers in the series.
WITH RECURSIVE_TEMP(ID) AS(
  --Anchor Block
SELECT MIN(ID) AS ID FROM NUMBERS

UNION ALL

  --Recursive Block
SELECT ID+1 AS ID FROM RECURSIVE_TEMP WHERE ID < (SELECT MAX(ID) AS ID FROM NUMBERS )
)
SELECT ID FROM RECURSIVE_TEMP
MINUS
SELECT ID FROM NUMBERS;
Alternate Solution:
In Oracle, we can use CONNECT BY clause to generate the sequence of numbers. In our case to generate the sequence of numbers based on min and max values of the series, below query can be used. The below query generates sequence of numbers from 1 till 20.
SELECT
   (SELECT MIN(ID) FROM Numbers)-1+ LEVEL AS ID
FROM dual
CONNECT BY LEVEL <= (SELECT MAX(ID) FROM Numbers);
The final expected output can be generated using the below query.
WITH TEMP AS(
  SELECT
     (SELECT MIN(ID) FROM Numbers)-1+ LEVEL AS ID
  FROM dual
  CONNECT BY LEVEL <= (SELECT MAX(ID) FROM Numbers)
)
SELECT ID FROM TEMP
MINUS
SELECT ID FROM NUMBERS;
10. Write a SQL Query to explode a single source record into multiple records based on the quantity.
Source:
The Source table Order_Details consists of two fields, Order_date and Orders which contains the numbers of orders received on that day.
CREATE TABLE ORDER_DETAILS(
   ORDER_DATE DATE,
   ORDERS INTEGER
);

INSERT INTO ORDER_DETAILS VALUES ('2021-01-01',2);
INSERT INTO ORDER_DETAILS VALUES ('2021-02-01',1);
INSERT INTO ORDER_DETAILS VALUES ('2021-03-01',3);
INSERT INTO ORDER_DETAILS VALUES ('2021-04-01',4);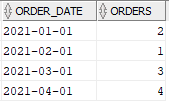
Expected Output:
The requirement is to explode the order_date entries in an incremental order based on the number of orders on that day. For example, on 2021-01-01, the number of orders is two. The expected output is to generate two output entries by incrementing the order_date. Thus the output contains entries as 2021-01-01 and 2021-01-02.
Solution:
We will be using the recursive WITH clause to explode the order_date entries by looping based on the orders and decrementing them until the value reaches one.
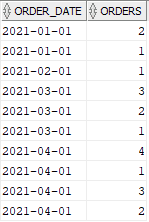
WITH TEMP(ORDER_DATE,ORDERS) AS(
--Anchor Block
SELECT ORDER_DATE, ORDERS FROM ORDER_DETAILS
UNION ALL
--Recursive Block
SELECT ORDER_DATE, orders-1 FROM TEMP WHERE ORDERS > 1
)
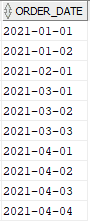
SELECT ORDER_DATE, ORDERS FROM TEMP ORDER BY ORDER_DATE;The output of above query will be as below
The above query only helped in exploding the order_date entries based on orders but the date is not incremented while exploding. We can increment the date in the final query using the orders again as shown below to get the expected output.
WITH TEMP(ORDER_DATE,ORDERS) AS(
  --Anchor Block
SELECT ORDER_DATE, ORDERS FROM ORDER_DETAILS

UNION ALL

  --Recursive Block
SELECT ORDER_DATE, orders-1 FROM TEMP WHERE ORDERS > 1
)
SELECT ORDER_DATE+(ORDERS-1) AS ORDER_DATE FROM TEMP ORDER BY ORDER_DATE;
Subscribe to our Newsletter !!
Related Articles:


perfect questions.Thanks for sharing.
Thank you!!👍👍
Thanks for sharing
👍👍
Nice explanation
Thanks Venkat!!